
How to Read a Spine MRI: A Patient's Guide
Decode your spine MRI report, understand disc levels, signal changes, and common findings explained in plain language.
Key Takeaways
- Sagittal views provide an overview of alignment and disc levels; axial views show nerve compression in detail
- Healthy discs appear bright on T2; dark discs indicate degeneration and water loss
- Herniations are classified by type (protrusion, extrusion, sequestration) and location (central, paracentral, foraminal)
- Stenosis severity is graded by the amount of CSF visible around the nerve roots
- Modic changes in vertebral endplates characterize the inflammatory stage of disc degeneration
- Disc degeneration on MRI is extremely common with aging and does not always correlate with symptoms
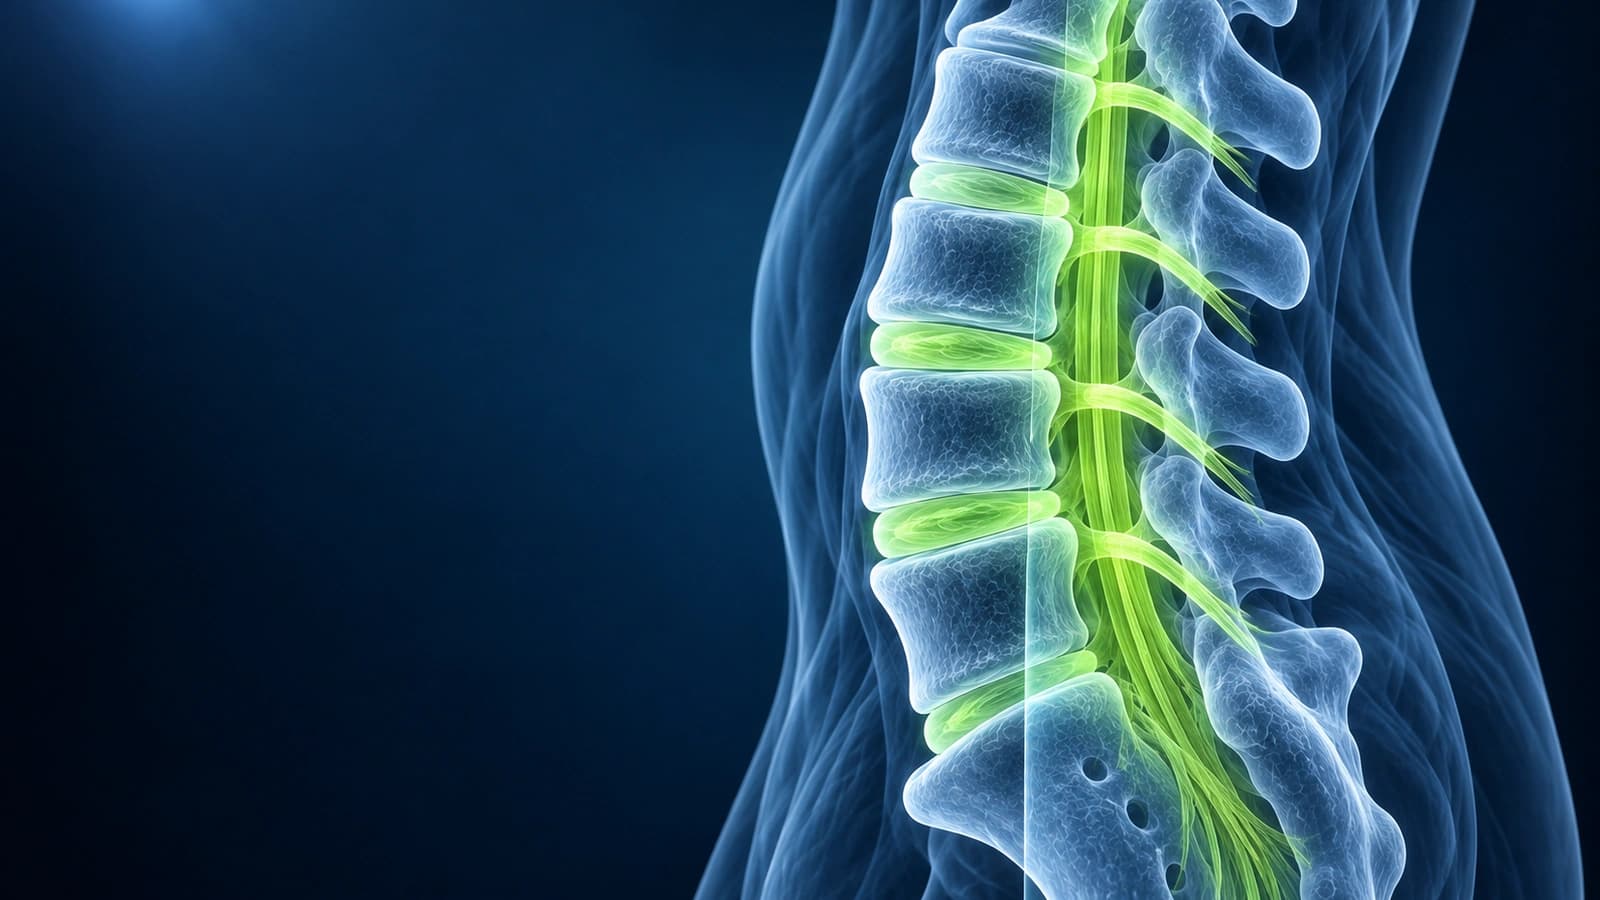
A spine MRI can reveal a wealth of information about your spinal anatomy — from disc herniations and stenosis to nerve compression and degenerative changes. For patients, understanding the basics of spine MRI can demystify the radiology report and help you grasp what is causing your back or neck pain. This guide covers the essential structures to identify, what normal versus abnormal looks like, and what common findings mean for your treatment.
Spine MRI is the most detailed imaging study available for evaluating disc disease, nerve compression, spinal stenosis, and other soft tissue abnormalities. Unlike X-rays or CT scans, MRI provides exceptional contrast between different soft tissues without exposing you to radiation, making it the preferred study for most spine conditions.
Spine MRI Views and Sequences
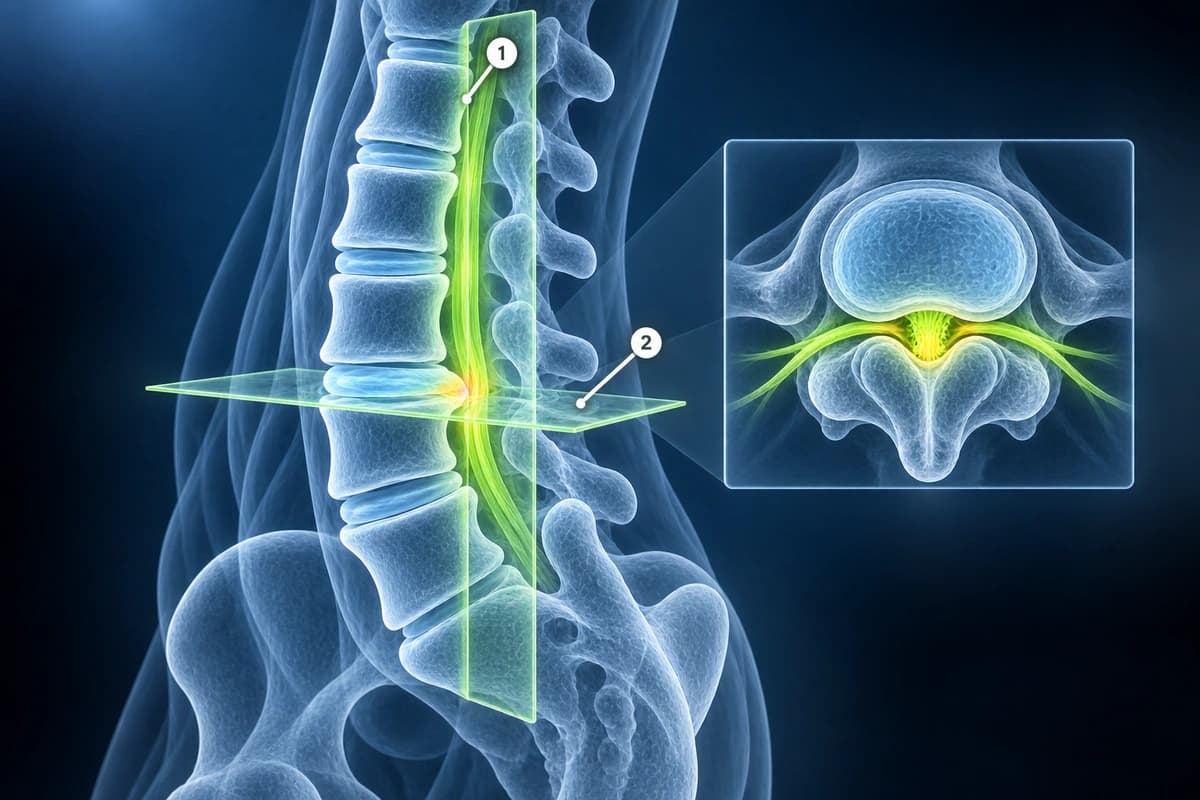
Spine MRI is acquired in sagittal (side view) and axial (cross-section) planes. The sagittal view provides an overview of multiple vertebral levels, showing disc height, alignment, and the spinal canal. Axial images provide cross-sectional detail at specific disc levels, showing the relationship between disc material, nerve roots, and the spinal canal.
T1-weighted images show anatomy clearly — normal bone marrow appears bright (due to fat), while discs appear intermediate gray. T2-weighted images make fluid appear bright — cerebrospinal fluid (CSF) in the spinal canal appears white, providing excellent contrast for identifying disc herniations, stenosis, and nerve compression. STIR sequences are sensitive to edema and inflammation.
Intervertebral Discs
Healthy intervertebral discs appear bright on T2 images due to their high water content. As discs degenerate, they lose water and appear progressively darker — this is described as desiccation or disc dehydration. Disc degeneration is graded using the Pfirrmann classification from Grade 1 (normal) to Grade 5 (collapsed disc space). Disc bulging means the disc extends beyond the vertebral body margins diffusely. A herniation is focal and classified as protrusion, extrusion, or sequestration.
On axial images, herniations are classified by location: central, paracentral (most common), foraminal, or far lateral. The direction determines which nerve root is affected. For more on natural disc healing, see our article on herniated disc natural healing.
Spinal Stenosis
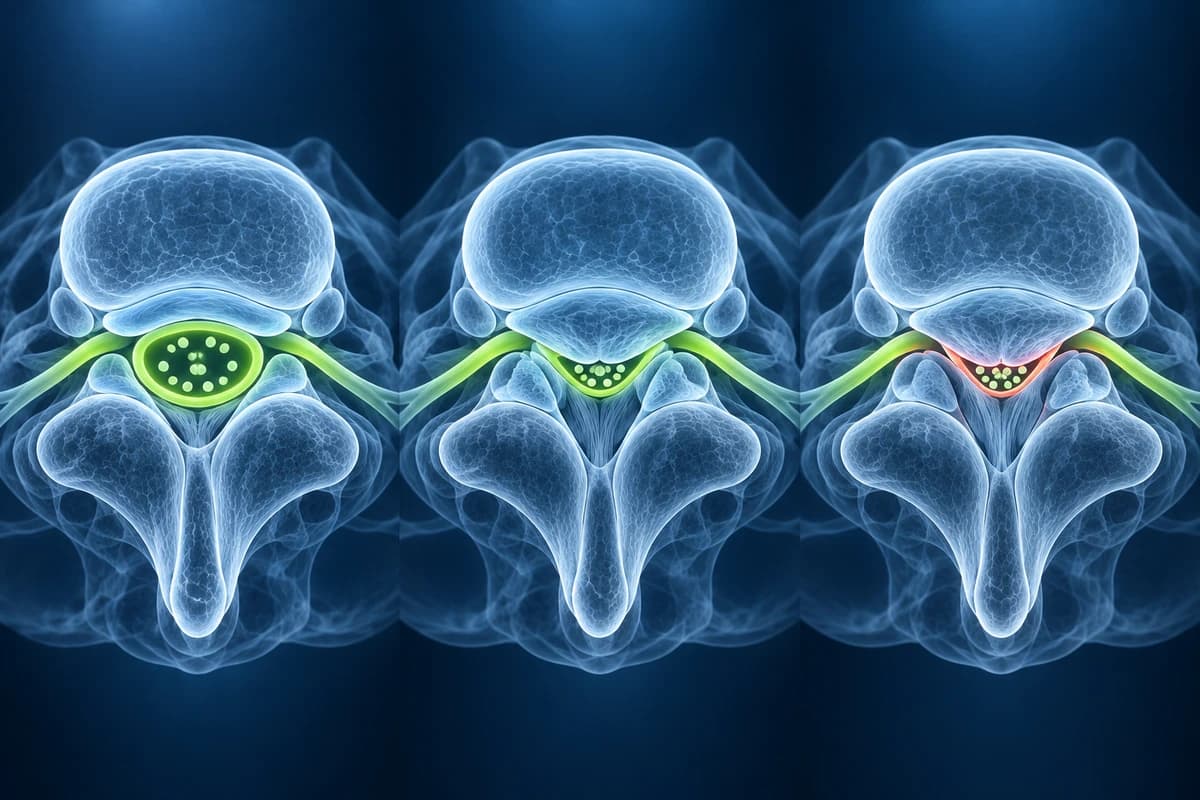
Spinal stenosis is narrowing of the spinal canal, lateral recesses, or neural foramina. On axial T2 images, central stenosis is assessed by evaluating the bright CSF visible around the thecal sac and nerve roots. In severe stenosis, there is no visible CSF and the nerve roots appear crowded. Foraminal stenosis is best assessed on sagittal T1 images by evaluating the bright fat signal normally surrounding the nerve root. Common causes include disc herniations, facet joint hypertrophy, ligamentum flavum thickening, and spondylolisthesis.
Nerve Compression
Identifying nerve compression requires correlating findings across views. On axial images, a compressed nerve root may be displaced, flattened, or surrounded by disc material. Signs of nerve inflammation include increased T2 signal within the nerve root itself. The level of compression determines the expected symptom pattern: L4-L5 herniation typically affects the L5 nerve root (causing foot drop), while L5-S1 affects the S1 root (causing calf weakness). For exercises that help with nerve compression, see our guide on spine exercises for herniated discs.
Vertebral Bodies, Alignment, and Posterior Elements
Vertebral bodies should be uniformly bright on T1 images. Dark signal on T1 with bright signal on T2/STIR suggests bone marrow edema from compression fracture, infection, or tumor. Modic changes are signal abnormalities in the vertebral endplates: Type 1 (edema, active inflammation), Type 2 (fatty replacement, chronic), and Type 3 (sclerosis). Spondylolisthesis (forward slippage of one vertebra on another) is easily identified on sagittal images.
The facet joints are paired synovial joints posteriorly at each spinal level. Facet arthropathy appears as joint space narrowing, osteophyte formation, and joint effusion. Hypertrophied facets contribute to stenosis. The ligamentum flavum normally measures less than 4 mm — thickening is a common contributor to spinal stenosis in the lumbar spine.
Frequently Asked Questions
Can a spine MRI show the cause of my pain?
MRI can identify structural abnormalities that may be causing pain, such as disc herniations compressing nerves, spinal stenosis, or vertebral fractures. However, many MRI findings are present in pain-free individuals — 60% of people over 50 have disc bulges without symptoms. Clinical examination and symptom patterns are essential for determining the pain source.
What does disc desiccation mean?
Disc desiccation means the disc has lost water content, causing it to appear darker on T2-weighted MRI images. This is part of normal aging and is nearly universal in adults over 40. Desiccated discs may have reduced shock-absorbing capacity but often cause no symptoms. It does not by itself require treatment.
What is the difference between a bulge and a herniation?
In the 2014 lumbar disc nomenclature, a bulge usually extends beyond more than 25% of the disc circumference and may be asymmetric. A herniation is a localized displacement involving less than 25%, described as protrusion or extrusion according to its shape. These terms describe anatomy, not the cause of pain or a treatment indication.
How do I know if my stenosis is severe?
On axial T2 images, look at the bright CSF signal around the nerve roots. In mild stenosis, CSF is slightly reduced. In moderate, CSF is significantly reduced. In severe, there is no visible CSF and nerve roots are compressed and indistinguishable. Clinically, severe stenosis causes neurogenic claudication — leg pain with walking that improves with sitting or leaning forward.
Sources
- Fardon DF, Williams AL, Dohring EJ, et al. Lumbar disc nomenclature: version 2.0: Recommendations of the combined task forces of the North American Spine Society, the American Society of Spine Radiology and the American Society of Neuroradiology. Spine J. 2014;14(11):2525-2545.
- Modic MT, Steinberg PM, Ross JS, et al. Degenerative disk disease: assessment of changes in vertebral body marrow with MR imaging. Radiology. 1988;166(1 Pt 1):193-199.
- Brinjikji W, Luetmer PH, Comstock B, et al. Systematic literature review of imaging features of spinal degeneration in asymptomatic populations. AJNR Am J Neuroradiol. 2015;36(4):811-816.
- Schizas C, Theumann N, Burn A, et al. Qualitative grading of severity of lumbar spinal stenosis based on the morphology of the dural sac on magnetic resonance images. Spine (Phila Pa 1976). 2010;35(21):1919-1924.
- Lee S, Lee JW, Yeom JS, et al. A practical MRI grading system for lumbar foraminal stenosis. AJR Am J Roentgenol. 2010;194(4):1095-1098.
Related Articles
Discover the natural healing process of herniated discs, resorption rates, and when intervention is needed.
Safe and effective exercises for herniated disc recovery, including McKenzie method, core stabilization, and movements to avoid.
Disc bulge vs protrusion vs extrusion vs sequestration, facet syndrome, vertebral fractures and stenosis — anatomy, MRI findings, and treatment options.
Related Conditions
Understand your imaging before your next appointment
MRI, X-ray or CT from a CD, folder or ZIP. A PDF report or photos of the films work too.
Free to open and preview, no account needed. An optional AI report from $10 explains your images in plain language, with questions for your doctor.
Your raw files stay on this device. Only rendered images and minimal context are sent when you request an AI report.
Medical Disclaimer: This page is for informational and educational purposes only. It does not constitute medical advice, diagnosis, or treatment. AI-generated analysis may contain errors. Always consult a qualified healthcare professional for medical decisions. Full Disclaimer